Use Story polls to learn, not just to collect taps
A poll is a tiny conversation starter. It becomes useful research only when the question is honest and the result changes what you make next.
The archived FollowRio blog proposed ways to use polls in Instagram Stories. The stronger modern lesson is to ask questions that reveal a real audience need, then check the answer against comments, customer conversations and the work you can actually provide.
Start with a decision you need to make
Before choosing a sticker, write the decision behind the poll. A ceramics maker might need to know whether customers struggle more with choosing a glaze or caring for a finished piece. A vague 'Which do you like?' can collect taps but leaves the next editorial move unclear.
Keep the options balanced and understandable without extra context. If one option sounds obviously better or more flattering, the answer measures your wording. Leave room for a reply when the two choices cannot describe a person's situation. The goal is not a scientific survey; it is a low-friction invitation to tell you what deserves a fuller answer.
Interpret the response with its limits
A Story poll reaches the people who saw that Story and chose to respond. It is not a representative sample of everyone you hope to serve. Do not convert a small result into a claim such as 'most customers want X'. Record the question, date, audience context and what else was happening on the account.
Look at the qualitative replies. If several people explain why neither answer fits, their detail may be more useful than the winning option. Compare the poll with recurring questions in comments, email or real conversations. When signals disagree, create a piece that explores the disagreement rather than pretending the numbers settled it.
Close the loop visibly
Tell the audience what you learned and what you will make because of it. If people asked about caring for ceramics, publish a clear care guide with examples, limits and a place for follow-up questions. If a poll suggested a need you cannot meet, say so rather than turning it into an empty promise.
A week later, ask whether the new material answered the original question. Useful replies, saves and specific follow-up questions can tell you more than the raw poll tally. Keep a short record of question, response, content made and remaining uncertainty so the next poll starts from learning, not novelty.
The poll-to-publication loop
Use this four-move card before and after a poll; adapt the platform feature to the controls available on your account.
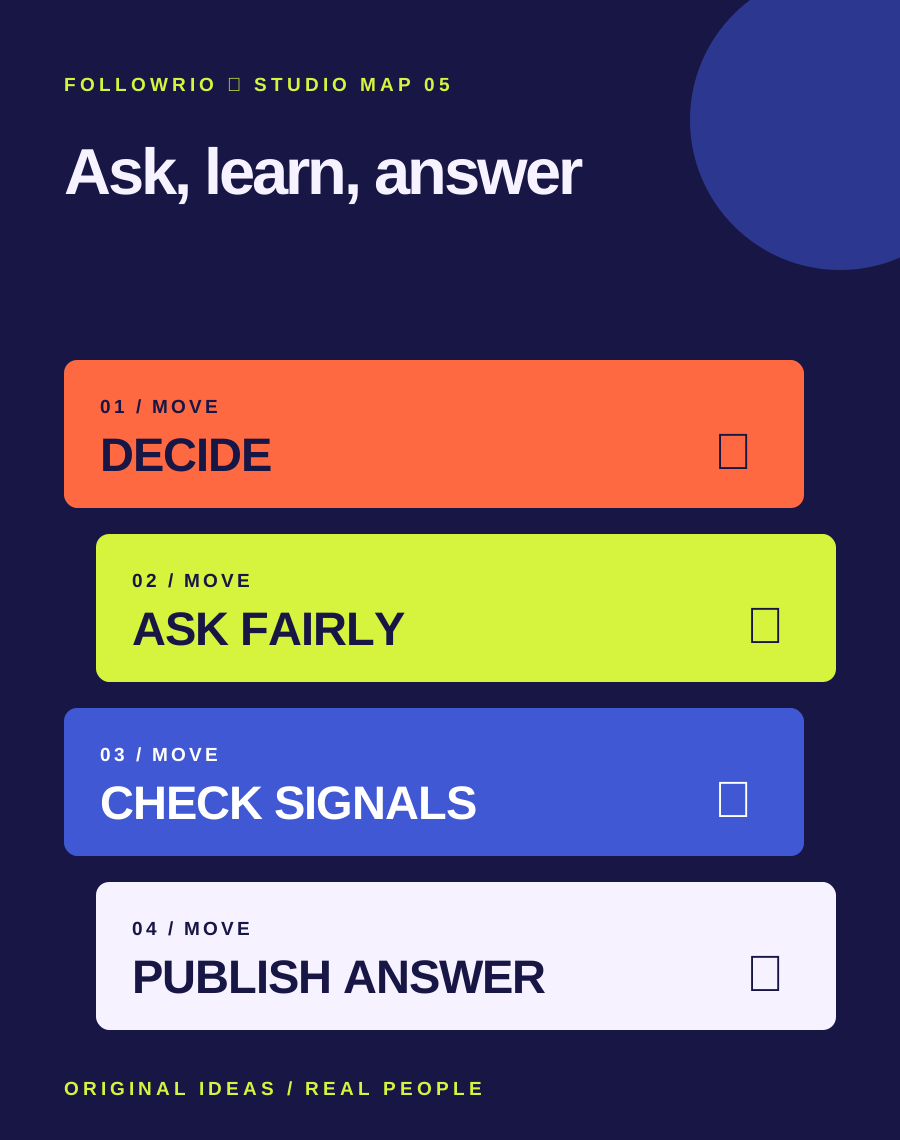
- Decide
Write the editorial choice you are trying to make.
- Ask
Use balanced options and invite context beyond the tap.
- Check
Read response count, replies and other audience evidence.
- Publish
Make one useful answer and report what remains uncertain.
Fictional example: a language tutor asks whether learners find pronunciation or remembering phrases harder. The replies favour pronunciation, but several people describe trouble practising alone. The tutor publishes a two-minute practice routine, includes a text transcript and asks which step remains difficult. The poll is treated as a clue, not a population estimate.
Availability and labels of Instagram stickers can change. Check the current app before writing button-by-button instructions, and never publish identifiable private replies without permission.
Read the context.
Archive captures identify the old question. Platform features and support routes can change; these links are starting points for checking the current state.
Keep the denominator beside the poll
The percentage displayed by a poll answers a narrow question: how the people who answered divided between the options. It does not describe everyone reached, every follower or all potential customers. Keep those groups separate in your notes.
Read a small result without inflating it
Suppose an illustrative Story reaches 80 accounts and 20 answer a two-option poll. Fourteen choose “care instructions” and six choose “choosing a glaze”. The first option receives 14 ÷ 20 = 70% of responses. Those 14 accounts are 17.5% of the 80 reached, while the response rate is 20 ÷ 80 = 25%. These denominators answer different questions. None establishes what the wider market wants.
| Question | Calculation | Honest reading |
|---|---|---|
| Who answered? | 20 / 80 = 25% | A quarter of reached accounts responded. |
| Which option led? | 14 / 20 = 70% | Care led among respondents. |
| What do non-respondents want? | Unknown | Do not assign the other 60 an opinion. |
Turn the result into one useful answer
- Save the exact question and both options, the date, reach and response count if available in your account. Record “unavailable” rather than reconstructing a count from a rounded percentage.
- Read replies for situations the options missed. Keep private messages private.
- Publish a care guide with one concrete cleaning example and the material limits you can verify.
- Ask whether the guide answered the problem. Keep contradictory replies alongside the poll result.
A defensible follow-up is “14 of 20 respondents chose care, so we made this guide.” Avoid “70% of customers need this.” There is no universal response-count threshold that makes a self-selected Story representative. Platform controls can change; the worksheet works with whatever counts you can actually retrieve.
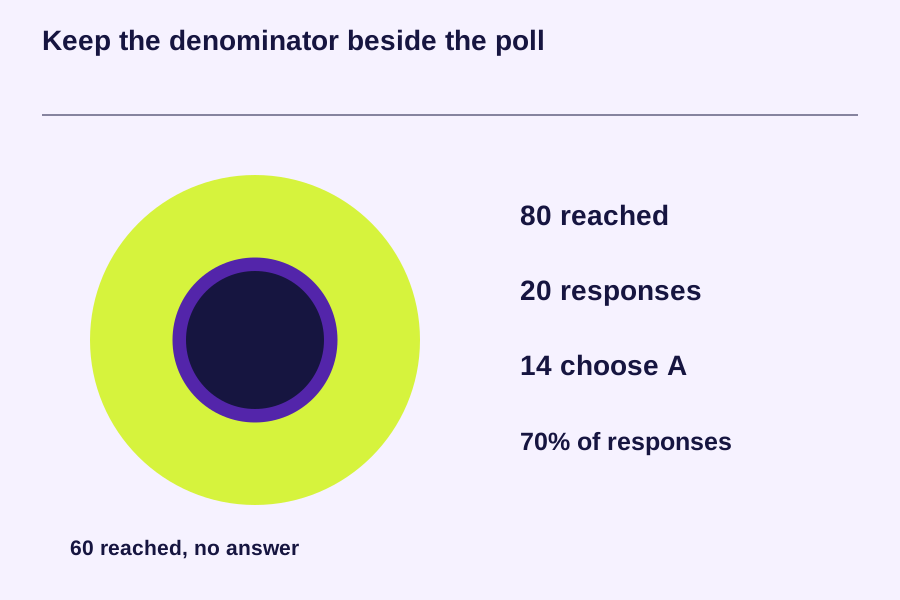
Text equivalent: 80 reached → 20 responses → 14 choose A → 70% of responses → 60 reached, no answer.
Download the working card ↓Written by FollowRio. Source: GOV.UK · User research: understanding needs.